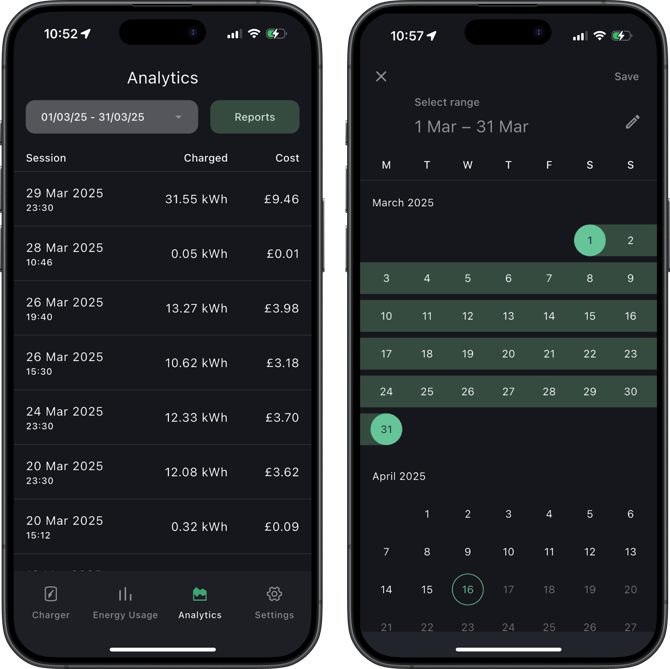
Analytics
Analytics shows your charging activity, including energy usage, cost estimates, and session history.
This data is intended to provide a useful overview of charging behaviour, but may not always exactly match vehicle or energy supplier data.
Data uploads to the cloud every 15 minutes for near real-time monitoring. High latency or unreliable WiFi can delay data transfer, resulting in longer intervals before the information appears in the app.
Charging data is not stored locally. It is uploaded to cloud servers, so the charger must be online to log activity. If data is missing from the app, the charger was likely offline during the session.
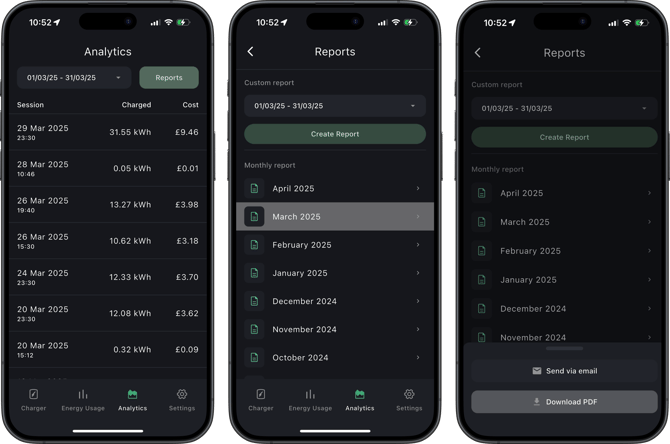
App Reports
Reports can be exported as a PDF, allowing you to download or email session data for any selected calendar month directly from the app.
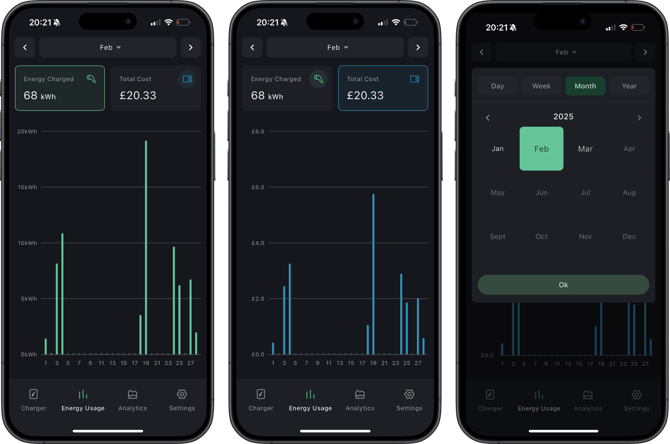
Energy Usage
Energy Usage provides an overview of historical charging activity. Users can switch between Energy Charged and Total Cost to better understand their usage.
Sessions that cross midnight may be split in Energy Usage but appear as a single session in Analytics, which can cause discrepancies between the two views.
The difference between Analytics and Energy Usage is how data is grouped. Energy Usage aggregates daily consumption across all sessions, while Analytics shows individual sessions.
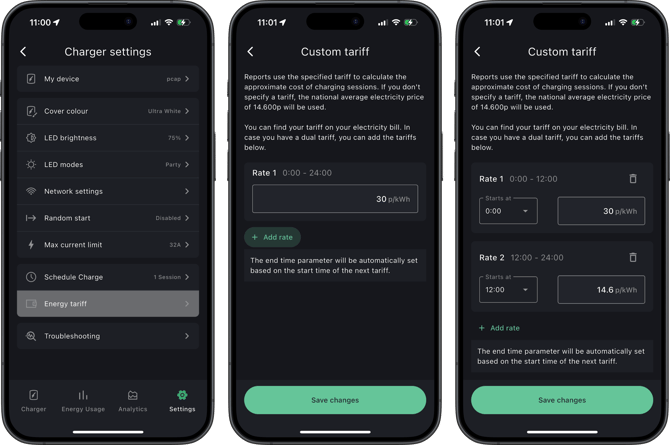
Energy Tariffs
Energy Tariffs lets users set their electricity rates in the app. This is used to calculate estimated costs in Energy Usage, Analytics and reports.
Cost is calculated using the tariff set in Energy Tariffs. Rates are applied in real time, so any changes will only affect future sessions. Once processed, cost data cannot be updated retroactively.
To set your tariff, open the app and go to Settings > Charger Settings > Energy Tariff.
Smart tariffs use dynamic pricing that changes based on real time energy demand. As rates can fluctuate frequently and are only visible to your energy provider, cost data is not shown when your charger is integrated with a smart tariff.
Adaptive Telemetry Replay Engine
This feature restores charging data after the charger has been offline. Once reconnected, it attempts to upload any missing data from the past 7 days so it appears in the app.
The replay process starts shortly after the connection is restored. If the connection is unstable, some data may not upload. Data older than 7 days cannot be recovered.